Submitted by Administrator on Thu, 07/01/2016 - 17:34
This page provides information on the mechanical characteristics of carbon fibre reinforced polymer (CFRP) stips. These characteristics were obtained from experimental testing on CFRP specimens manufactured and supplied by CarboNovus S.r.l. These CFRP laminates have been used as top and bottom layers of CFRP/PVC foam sandwich panel composite.
The ultimate tensile strength of three types of carbon fibre reinforced polymer (CFRP) strips has been investigated. These characteristics were obtained from experimental testing on 21 CFRP specimens. The specimens consist of 3 different CFRP sheet layups, which vary in their ply number and orientation (0°/90°, ±45° and unidirectional). In parallel, analytical models were used to predict the performance of the different test samples, to set-up the appropriate instrumentations and to verify the experimental data.
All testing and supporting analytical work contained in this report were undertaken according to ASTM D3039 (Standard Practice for Tensile Properties of Polymer Matrix Composite Materials).
Test specimens, Instrumentation and Test Set-up
Test specimens
Seven samples for each one of the three different types (T2, T3 and T4) were tested; their dimensions, lay-up, ply orientation are summarised on Table 1. They all have the same length being 250mm while rectangular cross-sections are different, being 25×2.5 mm² for T2 and T3 and 15×1 mm² for T4.
Table 1: Characteristics of the samples
|
Sample type |
Number of specimen tested |
Dimensions [mm] L × W × D |
Lay-up |
Ply orientation |
|
T2 |
7 |
250 × 25 × 2.5 |
Single Sheet Twill 0°/90° |
[0/90] |
|
T3 |
7 |
250 × 25 × 2.5 |
Single Sheet Biaxial ±45° |
[+/- 45] |
|
T4 |
7 |
250 × 15 × 1.0 |
Single Sheet Unidirectional |
[Unidirectional] |
Unidirectional, 0°/90° and ±45° woven, normal modulus CFRP sheets and Bakelite EPR L 1000 epoxy resin have been used for manufacturing.
Instrumentation
The destructive tensile tests were carried using a displacement controlled testing machine (Instron series 5500R) controlled by Windows based PC running “Bluehill” software. During the test the clamp displacements and loads were monitored and recorded. Strain gauges (Type BFLA-5-5; active length 5 mm; resistance 120 Ω) have been used to measure the longitudinal and transversal strain on the samples, as well as a laser extensometer has been used to measure displacement between two points of the samples.
|
|
|
|
|
(a) |
(b) |
(c) |


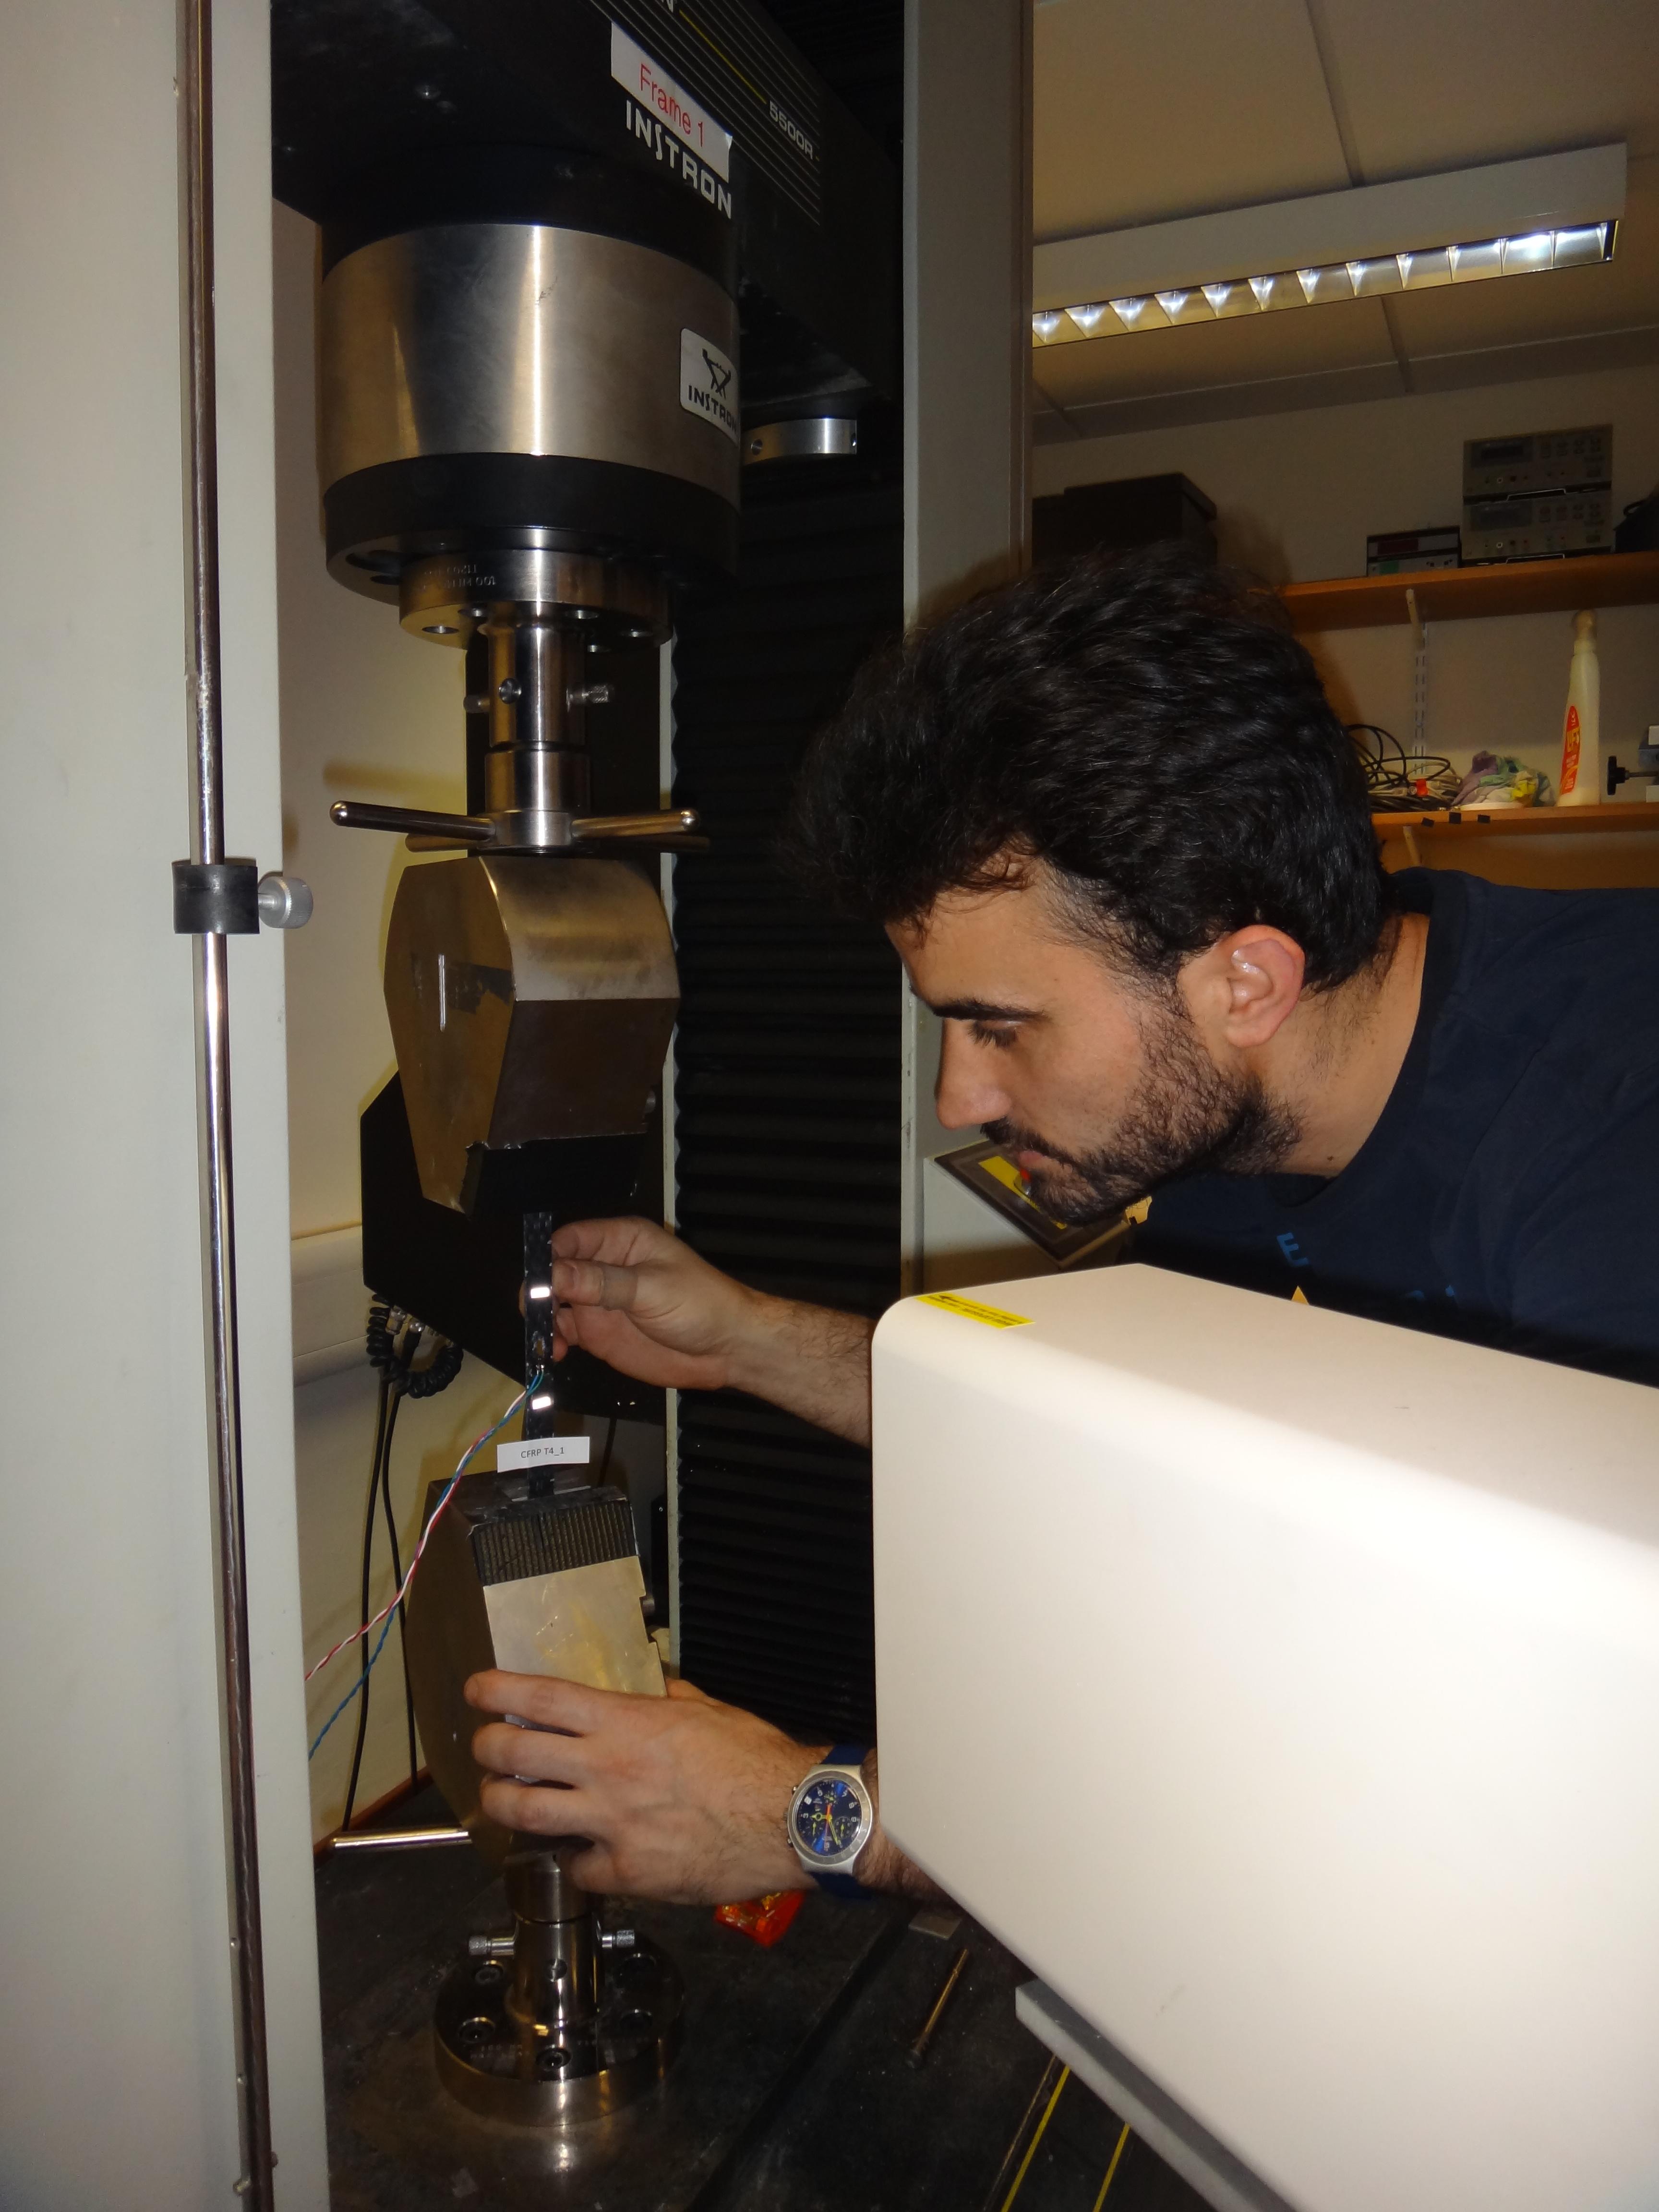
Figure 1: Test set-up configurations: (a) set-up with laser extensometer, (b) set-up for the unidirectional specimen, (c) set-up for ±45° specimen.
Data Acquisition
The instrumentation and the data acquisition system were linked together through a National Instrument data logger, NI PXIe-1071, and Windows based PC running LabVIEW software. This software is capable of synchronized data acquisition across different channels, in this case the displacements and the force signals. Instrumentation and the data Acquisition system are shown in Figure 2.

Figure 2: Data acquisition system.
Test set-up
A series of three strain gauges have been used on three samples of type T2, three of type T3, while four samples of type T4 have been equipped with two strain gauges only. For Sample T2 and T3 two strain gauge are placed on the front face of the specimen, one in longitudinal and one in transverse direction, while the third is located on the back face in longitudinal direction. T4 specimen is instrumented with two strain gauges, placed on the front and back both in longitudinal direction. This configuration allows any induced bending to be measured. The strain gauges are aligned along to the horizontal and vertical symmetric axis of the specimen. Additionally, a laser extensometer is used to record the specimen’s elongation; the gauge length is set to approx. 60 mm for the series T2, T3 and T4.
|
|
|
|
|
(a) |
(b) |
(c) |


Figure 3: Gage location for samples T2 and T3 (a) front view; (b) back view; and T4 (c) front view.
Alignment and positioning of the specimen
The loading arms were attached to the load cell with a freely rotating pin to accommodate any deviation from the horizontal plane. The test rig was checked manually by taking measurements to ensure there is no rotational misalignment.
The specimen was positioned onto the supports with the labelled surface forwards. The strain gauges were connected to data logger cables. The voltage output conversion for the data loggers was set on the PC. The laser extensometer was reset to 0 and the exact gauge length was recorded.
Setting up the loading programme
The test is displacement controlled: the cross-head speed is 1mm/min and produces a nearly constant strain rate of 0.01 min-1 as recorded by the strain gauge. Failure occurred as expected within 1 to 10 minutes.
The test was set to stop when the load drops suddenly by 99% (loading until failure), the maximum safe travel of the cross-head has been reached, or when the maximum safe load (150kN) has been reached. A manual emergency stop was available for use if the tests were no longer deemed to be safe.
Running and recording the test
The specimen was first clamped into the upper grip fixture and then the lower end is adjusted and clamped. This was necessary in order to prevent buckling throughout the entire fixing process. The gauge length is then reset to zero and the test started.
Results and Analysis
Tensile test data
Before testing all the sample dimensions has been recorded.

Figure 4: Thickness measurement with micrometer
Classification of failure modes
A total of 21 static tensile tests were performed. The measured properties include tensile load and strain at failure. For T2 and T4 series, failure occurred spontaneously and explosively. Strength loss for this test series T3 was less sudden and with larger deformations. Figure 6 shows some of the different failure modes for the four different specimens.
|
|
|
|
|
(a) |
(b) |
(c) |


Figure 5: Failure modes for (a) T2 [0/90], (b) T3 [±45], (c) and T4 [0]
Test series T2 failed in most cases in an explosive way resulting into ply delamination. After failure it has been observed that the back layer was not aligned with the front one, but it has a misalignment of about 30° (see Figure 6) which affects the behaviour of the strips and does not allow to compare the experimental value with the theoretical estimated one.
The failure mode of T3 is governed by an angled (45°) crack along the fibres (fibre orientation ±45°) located close to the clamp.
The specimens of T4 testing series failed predominantly in longitudinal splitting along its unidirectional orientated fibres. It also showed misaligned fibres of about 5-10°; in so only a reduced portion of them where continuous along the specimens and the theoretical value could not be used as valuable comparison.
|
|
|
|
(a) |
(b) |


Figure 6: Failure modes for T2 [0/90] (a) Front (b) Back
Analysis of the data
The samples of T2 and T4 exhibit a predominantly linear material behaviour up to failure (see Figure 7 and Figure 9). Instead the loading-crosshead movement relationship of the set T3 is dominated by two regions with significantly different stiffness as shown in Figure 8. In the initial stage of loading, the woven mesh of ± 45 degrees oriented fibres rearrange physically until they reach a the tightest fabric structure. During this process the interface between the resin and the fibres fails. This is followed by a second stage of reduced stiffness until eventually the tensile strength of the resin is exceeded. Therefore, it is assumed that after the rearrangement of the fibres and the failure of the resin-fibre interface, the load bearing contribution of the fibres is diminished.
All the tests show similar behaviour of the material and similar values in the ultimate tensile strength.

Figure 7: Load-Strain relation for sample type T2

Figure 8: Load-Strain relation for sample type T3
Figure 9: Load-Strain relation for sample type T4